This is a cozy place where I can share my thoughts on various things I find myself reading in order to help promote literacy among young people. Feel free to make some recommendations for my reading list!
Remember those infographics?
Get link
Facebook
X
Pinterest
Email
Other Apps
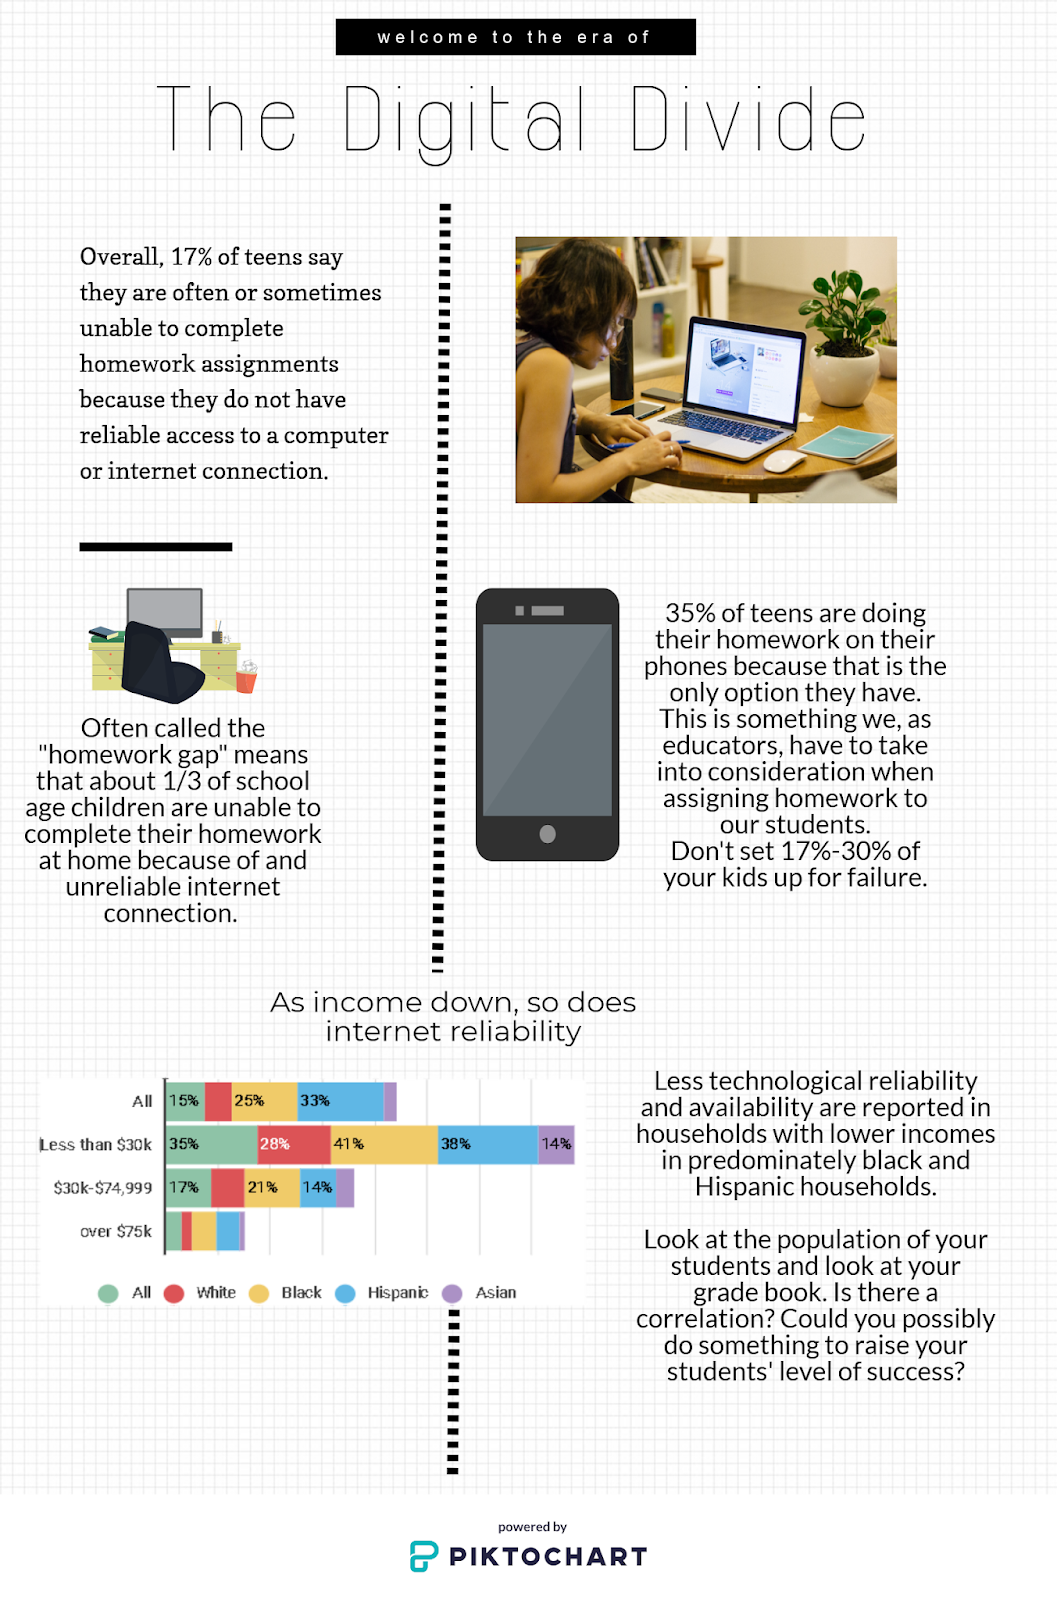
I used Piktochart (and Easel.ly for the chart) to create this infographic about an article you can find here. I started with a blank page and not a template so it was a struggle at first, but exploring it was fun.
Hi Dana! I liked your infographic, especially the chart. It was fun to play around with the different sites and see how much they can offer! I think that older kids would have a great time summarizing articles with infographics because of all the fun visuals they could make. Good job!:)
This is a great example of an infographic! I also love Piktochart. It is easy to use and makes quality graphics that students can really learn from...and produce!
Your infographic was an eye opener! It is stunning that more students do not have access to a computer or laptop at home with internet connectivity and they are only left with using their phones. It is definitely something for teachers to keep in mind when creating homework assignments. There is a huge push for teachers to use technology in the classroom, but students need to be given time to complete work in the class or in the library since they may not have access at home.
Bibliography Freedman, Russel. (2004). “ The Voice that Challenged aNation: Marian Anderson and the Struggle for Equal Rights .” New York, NY: Houghton Mifflin Company. ISBN: 0-618-15976-2 Summary This book tells the story of Marian Anderson, a famous vocalist, who had to deal with overcoming racism and criticism while “pursuing her art in the context of the social and political climate of the” 30s and 40s. Analysis One of the most striking features of this book is the photographs of Marian Anderson and the people in her life. They lend a familiarity to the reading that makes the reader feel more involved in the story. They also show irrefutable evidence of the segregation that plagued the nation at the time. There are signs for “colored” balconies, waiting rooms, train cars and cab stations. As somebody who has only heard of signs like that, I find it bewildering that...
This is 2019, the year of "anything is possible" right? Well I have found the light readers! I don't know about you but I use infographics in my class from time to time to help the kiddos understand various processes or concepts. I do it the "old fashioned" way: Microsoft Word! I used word to create syllabi, Greek god charts, storyboards, character maps etc. and it took HOURS to get everything to line up and layer correctly and then one piece would always end up on another page and make me cry. Those days are over y'all. OVER. I played around with 3 different websites that help users build infographics to use all willy nilly. The first is Infogram ! This site was very simple to work with and manipulate but didn't allow as much freedom with the templates as I wanted. It did, however, have a lot of options as what what type of graphics you want to create. Reports, slides, facebook posts etc. allow this to be used for a lot of purposes. It is limited to...
So this post will not directly address a book like all the others have! In this post, I will be sharing a little bit of information about a thing called a "Feed Reader." If you are the type of person who enjoys following various blogs but does not always enjoy surfing forever to find them, a feed reader is definitely something you need! They compile the posts on as many blogs as you would like to follow and present them to you as a feed. Its almost like Facebook, but with blogs instead of friends. There are a lot to choose from so navigate them carefully and decide which suits you better. Is it IOS friendly? Can I rate certain articles to better narrow down new blog choices? Is it free?! Will there be ads if I don't pay? Is the cost worth the convenience? As you can tell, I ask a lot of questions. The feed reader I chose to try out was Feedly, largely because it is free but also because it reminds me of Google's email server which is easy for me to navigate. S...

Hi Dana! I liked your infographic, especially the chart. It was fun to play around with the different sites and see how much they can offer! I think that older kids would have a great time summarizing articles with infographics because of all the fun visuals they could make. Good job!:)
ReplyDeleteThis is a great example of an infographic! I also love Piktochart. It is easy to use and makes quality graphics that students can really learn from...and produce!
ReplyDeleteVery engaging infographic. Its simple and effective format delivers important stats in a way the doesn't overwhelm you. Mission accomplished!
ReplyDeleteYour infographic was an eye opener! It is stunning that more students do not have access to a computer or laptop at home with internet connectivity and they are only left with using their phones. It is definitely something for teachers to keep in mind when creating homework assignments. There is a huge push for teachers to use technology in the classroom, but students need to be given time to complete work in the class or in the library since they may not have access at home.
ReplyDelete